Grecian in Cumbria
Member
- Joined
- Mar 29, 2021
- Messages
- 251
Looking good now .....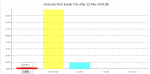

Excellent, play offs still on. Let's hope for a Peterborough win tonight! #giddyLooking good now .....View attachment 14980
A win on Saturday will put us within touching distanceSeven point gap to Cheltenham. A draw there would be enough.
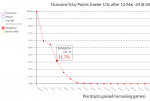
I’m not sure that graph can be right GoT as Wycombe and Wigan are both on 47 points already and are down as 0.0% chance of relegation, so surely 3 more points gets us there too??View attachment 14984
from https://www.probs4.club/team/ExeterCity#TPOPl
Six more point as good as guarantees safety.
Three more points, more likely to survive (68.3%)
Wigan are at 0.1% & Wycombe 0.0% but these are to one decimal place, so that's between, 5-14 times in 10,000 for Wigan & 1-4 times for Wycombe.I’m not sure that graph can be right GoT as Wycombe and Wigan are both on 47 points already and are down as 0.0% chance of relegation, so surely 3 more points gets us there too??
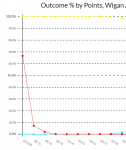
we are talking different percentages for different things.Sorry to go on but that still suggests there is a mistake. If Wycombe currently finish in the bottom 4 on only 1-4 out of 10,000 runs of the model, why does the graph in your latest post have them as 100% chance of relegation if they get no more points and 25% if they get one more point? Surely that red line should be flat at 0% (or a flicker above for 0 or 1 more point gained) for Wycombe and similarly for Wigan?
Ok fair enough I will get back in my box - I understand the difference nowwe are talking different percentages for different things.
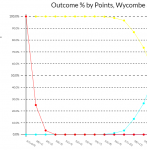
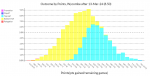
Consider https://www.probs4.club/team/Wycombe#TPO
View attachment 14988
so the amount in red accounts for 0.03% of Wycombe's likely outcomes.
From the 10000 predicted outcomes Wycombe get relegated four times 0.04% (rounded to 0.0%)
The data from the previous chart shows a percent for relegation IF team gets that number of points so ... for Wycombe ...
for 47 points (0 more points) 1 occurrence with 1 relegation hence 100.0% (1/1)
for 48 points (1 more points) 8 occurrence with 2 relegation hence 25.0% (2/8)
for 49 points (2 more points) 29 occurrence with 1 relegation hence 3.4% (1/29)
for 50 points and above (3 more points) 0 relegation hence 0.0%
Hope this helps you understand what the charts are trying to show.
