• We use cookies to ensure that we give you the best experience on our website. If you continue without changing your settings, we'll assume that you are happy to receive all cookies from this website. Read more here

The Probability Thread 2022

Joined
Apr 17, 2008
Messages
852
Location
www.probs4.club
Obscure stat warning

Over the last couple of weeks & especially after the weekend's results the likely points gap between 3rd(autos) & 8th(nothing) has been narrowing.

If you take current ppg and calculated projected points over 46 games the table looks like this:
1647289247033.png
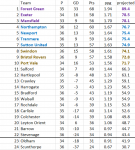
Using the above calculation difference between 3rd & 8th is only 4.0 points, between 2nd & 10th is 6.8

The average difference between 3rd & 8th here is 7.1 suggesting the gap is more likely to increase.

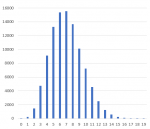
But I did wonder what is the chance of 3rd & 8th (& everyone in-between) finishing on the same number of points ...

I put an extra check in my code & ran 100,000 simulations to find 5 occurrences where 3rd & 8th finished on the same number of points ... so 0.005%

raw data from the five runs:
1647291016143.png
City's position in red (3rd only once)

Chart showing points difference between 3rd & 8th from 100,000 simulations, seven points most likely gap.
1647290589741.png
 
Last edited:

Trapdoor

Active member
Joined
Sep 19, 2020
Messages
1,822
Fantastic bit of uncertainty analysis! Very impressive.

Is that points spread prediction using straight Monte Carlo or is it using some weighting for team prior performance and the opposition faced in remaining games?
 

andrew p long

Very well known Exeweb poster
Joined
Jan 6, 2006
Messages
12,757
Location
Hagley, Stourbridge
A non statistical way of showing the (lack of a) gap between 3rd and 8th was our position last Tuesday.

The win took us to third. A draw would have meant being 8th instead.

The horrible thought is if this is the same (lack of a ) gap on the final day of the season. A team could be winning on 93 minutes and in the automatic promotion spot, but concede an equaliser and fall not just out of the autos but also out of the play offs too!

PS two further questions. Has the probability of automatic promotion slipped back below 50%? And (similar to Trapdoor's question) is this statistical analysis impacted by Sam Nombe's fitness ie if Sam is ruled out for the rest of the season does that affect what the model shows?
 
Joined
Apr 17, 2008
Messages
852
Location
www.probs4.club
Fantastic bit of uncertainty analysis! Very impressive.

Is that points spread prediction using straight Monte Carlo or is it using some weighting for team prior performance and the opposition faced in remaining games?
Simple answer is YES .. see post#1 & post#1 from last season for a little more info.
 

Trapdoor

Active member
Joined
Sep 19, 2020
Messages
1,822
So because its using current recent form as an input that may be skewing results towards ECFC being higher up the table than may happen in reality. Just since our recent form is so good and maybe we cant expect our form to continue indefinitely particularly with some bogey teams like Northampton still to play.
 

grecian-near-hell

Well-known Exeweb poster
Joined
Feb 12, 2009
Messages
6,393
Location
Cornwood
So because its using current recent form as an input that may be skewing results towards ECFC being higher up the table than may happen in reality. Just since our recent form is so good and maybe we cant expect our form to continue indefinitely particularly with some bogey teams like Northampton still to play.
We were Mansfield's bogey team until this year, so I wouldn't get hung up on that one, 'tis a strange season this one
 
Joined
Apr 17, 2008
Messages
852
Location
www.probs4.club
So because its using current recent form as an input that may be skewing results towards ECFC being higher up the table than may happen in reality. Just since our recent form is so good and maybe we cant expect our form to continue indefinitely particularly with some bogey teams like Northampton still to play.
The split between season form & current form is 60/40 that's before a random factor is applied, plus the current form calculation includes an adjustment depending on the strength of the recent opponents [this part is new this season]. I've done extensive (probably excessive) runs against historical data so the model I think is fairly good and contains about the right mix of "form remaining good" & "thinks going downhill" (& everything in-between). The model knows Northampton is a strong team, but it doesn't know it's our bogey team, that is NOT on the "possible improvements list"
 

grecian-near-hell

Well-known Exeweb poster
Joined
Feb 12, 2009
Messages
6,393
Location
Cornwood
Away from the great work done by G-O-T oddschecker now has us as second favourites to win the division varying between 9/1 - 12/1 depending on bookmaker, it's still the Vegans to lose but their odds have come down to between 1/14 and 2/9. For promotion if the bookies are to be believed the Vegans are up already up 1/200 by those quoting, we are between 8/11 and 8/13
 
Joined
Apr 17, 2008
Messages
852
Location
www.probs4.club
Now 73% sorry about the green
others:
FGR 97%
Mansfield 43%
Northampton 28%
Port Vale 18%
+ four others around 9% each.

at least a playoff place now 97% 1648414933604.png
 

HarryECFC

Member
Joined
Feb 23, 2011
Messages
878
Now 73% sorry about the green
others:
FGR 97%
Mansfield 43%
Northampton 28%
Port Vale 18%
+ four others around 9% each.

at least a playoff place now 97% View attachment 8174
Amazing statistics, makes very interesting to read. Wonder what the stats are for flopping playoffs?
 
Top