Grecian-on-Tyne
Member
So, we have had our first game of 2022 and the season is somewhere around the halfway mark. I thought now would be a good time to start the Probability Thread for 2022.
Ok, it might just be a ploy to share the links to my website and update you on what’s new for this season.
http://www.probs4.club/p4cLge/lge2
http://www.probs4.club/p4cTeam/ExeterCity
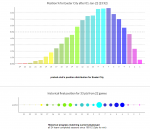
The main changes for 2021/22 is under the bonnet. The calculations used have been extensively revised, I’ve ran numerous variations of the ‘model’ against historical data (20 seasons x4 leagues, from 1999-2019) collating the predicted vs actual to find a realistic spread of possible outcomes. The biggest change has been to the ‘random factor’ intended to give a realist spread to the possible outcomes, to achieve this I’ve added what could be called a ‘chaos factor’ to help cater for the dramatic upturn or downturn in form that occurs more often than last season’s model would calculate.
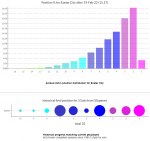
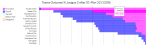
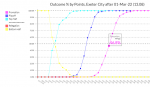
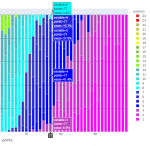
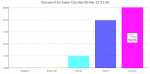
Another addition this year are some charts comparing current season with historical data, hopefully some of these will give an alternative but compliantly view of our (and the other 91) position.
This thread is starting a lot earlier than previous years, two reasons:
1: Because I am confident the calculations and resulting percentage outcomes are about as accurate you can get, without using off-field & other subjective factors (eg. Playing budget, key player injuries, new manager etc.)
2: If our ‘downturn’ continues, even for those who do take a interest in this thread will soon lose interest or if we do start winning before it’s too late you will be able to track our upward progress.
(link to last years thread https://www.exeweb.com/forums/threads/the-probability-thread-2021-…-now-with-website-probs4-club.62808/
Ok, it might just be a ploy to share the links to my website and update you on what’s new for this season.
http://www.probs4.club/p4cLge/lge2
http://www.probs4.club/p4cTeam/ExeterCity
The main changes for 2021/22 is under the bonnet. The calculations used have been extensively revised, I’ve ran numerous variations of the ‘model’ against historical data (20 seasons x4 leagues, from 1999-2019) collating the predicted vs actual to find a realistic spread of possible outcomes. The biggest change has been to the ‘random factor’ intended to give a realist spread to the possible outcomes, to achieve this I’ve added what could be called a ‘chaos factor’ to help cater for the dramatic upturn or downturn in form that occurs more often than last season’s model would calculate.
Another addition this year are some charts comparing current season with historical data, hopefully some of these will give an alternative but compliantly view of our (and the other 91) position.
This thread is starting a lot earlier than previous years, two reasons:
1: Because I am confident the calculations and resulting percentage outcomes are about as accurate you can get, without using off-field & other subjective factors (eg. Playing budget, key player injuries, new manager etc.)
2: If our ‘downturn’ continues, even for those who do take a interest in this thread will soon lose interest or if we do start winning before it’s too late you will be able to track our upward progress.
(link to last years thread https://www.exeweb.com/forums/threads/the-probability-thread-2021-…-now-with-website-probs4-club.62808/